How to Read an HPLC Chromatogram: Peaks, Shoulders, and Where Impurities Come From
A peptide purity number is one line pulled from a chromatogram. This is how to read the trace itself: the main peak, shoulders, co-elution, and the chemistry behind the common impurities.
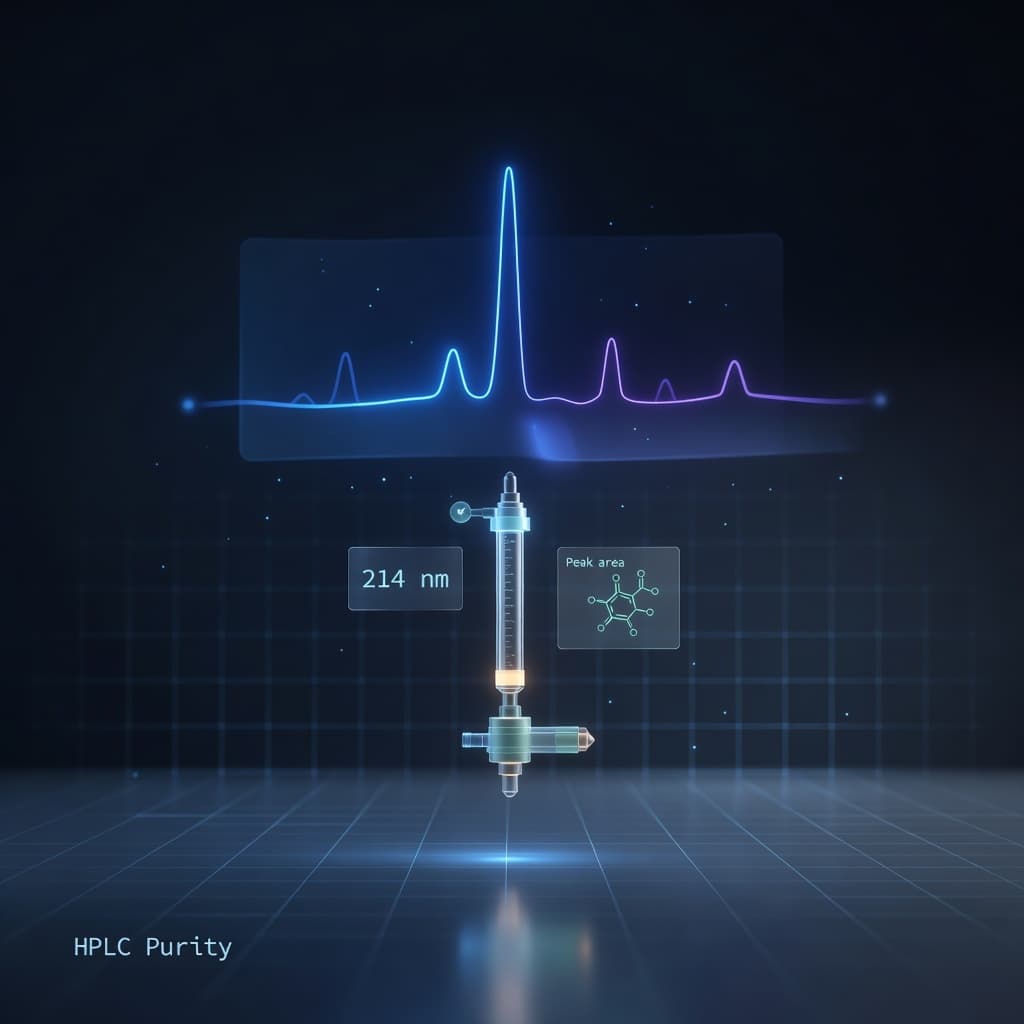
A certificate reduces a whole chromatogram to a single number: "purity 99.2%". That number is an area calculation over a trace with a shape, and the shape is where the information is. A shoulder on the main peak, a cluster of small peaks late in the run, two things hiding under one apex: each has a cause worth understanding. Most trace back to how the peptide was made, some to how it was stored or handled, and some to the method itself.
This article is about reading the trace, not comparing techniques. We already cover HPLC versus mass spectrometry, grades, and counterions separately. Here the question is narrower and more practical: when you look at the plot behind the number, what are you actually looking at?
TL;DR: what the trace is telling you
The x-axis is time, the y-axis is absorbance. A peptide chromatogram plots detector signal (usually UV at 214 nm) against retention time in minutes. Each peak is detector signal from material eluting at a given moment. Purity is one peak's area as a share of all the area. "99.2%" means the main peak is 99.2% of the integrated signal. It is a ratio, not a mass. A shoulder often marks a near-identical impurity. Deletion sequences, deamidation and oxidation products elute close to the target because they are chemically close to it. Co-elution is the trap. Two compounds under one peak read as pure. This is exactly why the EMA applies its qualification threshold to the whole co-eluting peak, and why a second method matters. The one impurity mass spec cannot flag: a mirror-image isomer. Same molecular formula and mass, different stereochemistry. Only HPLC retention time separates it, and only if the method resolves the two.
The two axes, and the main peak
A reversed-phase HPLC run pushes the sample through a column with a gradient: the solvent starts mostly water and becomes progressively more organic. Compounds that barely interact with the column leave early; more hydrophobic ones are held back and leave later. A detector at the end measures how much UV light the eluting stream absorbs, typically at 214 nm, the wavelength the peptide bond itself absorbs. The plot is that absorbance against time.
The tallest, largest peak is normally the target peptide. Purity by HPLC is an area calculation: the software integrates the area under every peak, and the main peak's area divided by the total integrated area is the purity percentage. Two consequences follow immediately, and both matter when you read a real certificate:
- It is a proportion, not a quantity. A 99% pure peptide can still be underfilled. Purity says nothing about how many milligrams are in the vial. That is a separate measurement, and we walk through the difference in reading an actual certificate field by field.
- What gets excluded changes the number. The injection or void peak at the very start, where unretained material washes through, is normally left out of the calculation. So are peaks the analyst attributes to the solvent or the blank. Change what is integrated and the percentage moves, which is one reason the same sample can produce different purity figures in different labs.
Shoulders, tailing, and co-elution
Once you can see the main peak, the impurities are the other analyte peaks, after you set aside the void, injection, solvent and blank signals a lab documents. Their position is a clue to what they probably are, not proof.
A shoulder is a partly resolved peak sitting on the flank of the main one, often close enough that the two are not separated back to baseline. Shoulders commonly come from impurities that are chemically almost the target: a chain missing one amino acid, or one where a single residue has been chemically altered. Such species are close in structure, so they are close in retention time. A shoulder can also be a method or overload artefact, so its shape alone does not identify what it is.
Tailing is when a peak drags out on its trailing side instead of coming down symmetrically. It is often a column or method artefact rather than a separate compound, but a heavy tail can also hide a small impurity eluting just after the main peak.
Co-elution is the one to respect. Two different compounds can leave the column at the same time and merge into a single apparent peak. On the trace they look like one clean peak, and the purity number counts them as one. This is the failure mode a purity percentage cannot warn you about by itself, and it is precisely why regulators treat co-eluting peaks more cautiously.
How the EMA treats co-eluting peaks
The EMA's guideline on synthetic peptides (EMA/CHMP/CVMP/QWP/367182/2025, in force since 1 June 2026) works from the European Pharmacopoeia thresholds: impurities are reported from 0.1%, identified from 0.5%, and it states that "when co-eluting impurities are observed as one peak the qualification threshold of 1.0% applies unless otherwise justified". In plain terms: because one observed peak can contain more than one unresolved impurity, the guideline applies the 1.0% qualification threshold to the combined co-eluting peak unless there is justification to do otherwise. That guideline governs approved medicines, not research chemicals, and none of the products discussed here fall under it. It is simply a published example of how the analytical community treats a peak it cannot fully resolve. We go through the whole document in our guide to the EMA guideline.
Where the impurities actually come from
The small peaks on a peptide chromatogram are not random noise. Each family has a chemical origin, and many are created during synthesis, one coupling step at a time, though oxidation and deamidation can also grow later during storage. Understanding the origin is what turns "there are some little peaks" into "that is a deletion sequence, and here is why it is there".
- Chemical origin
- A coupling step failed, so the chain is missing one residue
- Where it shows on the trace
- Close to the main peak, often a shoulder; direction depends on the missing residue
- Can mass spec tell it apart?
- Yes, it is lighter by that residue's mass
- Chemical origin
- The chain was capped or stopped early
- Where it shows on the trace
- Varies with the residues lost
- Can mass spec tell it apart?
- Yes, clearly lighter
- Chemical origin
- Asparagine converts to aspartate or isoaspartate, glutamine to glutamate or iso-glutamate, adding about 1 Da
- Where it shows on the trace
- A shoulder very close to the main peak
- Can mass spec tell it apart?
- Only just: a 1 Da shift is easy to miss
- Chemical origin
- Methionine, tryptophan or cysteine picks up oxygen, adding about 16 Da
- Where it shows on the trace
- Usually earlier, because the product is more polar
- Can mass spec tell it apart?
- Yes, plus 16 Da
- Chemical origin
- A single residue flips to its mirror-image form during synthesis
- Where it shows on the trace
- A separate peak, sometimes well resolved, sometimes a shoulder
- Can mass spec tell it apart?
- No: identical mass, only retention time separates them
- Chemical origin
- A protecting group was not fully removed
- Where it shows on the trace
- Often later (protecting groups are usually hydrophobic), but it depends
- Can mass spec tell it apart?
- Yes, heavier by the group's mass
- Chemical origin
- The peptide sticks to itself or to a scavenger molecule
- Where it shows on the trace
- Variable, often broad or late
- Can mass spec tell it apart?
- Sometimes, depending on the species
The epimerization row is the one worth pausing on. A D-isomer has exactly the same molecular formula and exactly the same mass as the correct peptide. A mass spectrometer, which identifies compounds by weight, sees nothing wrong. Only the retention-time separation on HPLC catches it, and only if the method resolves it. This is the concrete reason "we ran mass spec, it is the right peptide" and "the HPLC is 99% pure" are answering different questions, and why certificates that carry both cover more than either alone.
One thing that is not a chromatogram peak, despite being everywhere in peptide chemistry: TFA (trifluoroacetic acid). It is the acid added to the mobile phase and the counterion that pairs with the peptide's charges in the dried salt. It does not usually appear as a meaningful impurity peak in the 214 nm trace. Its relevance is to net peptide content, how much of the vial's weight is actually peptide versus counterion and water, which is a different measurement from purity entirely.
Why the same peptide gives two different purity numbers
If a purity figure were an absolute property of the material, every lab would report the same number. They do not, and the reasons are all in the method:
- The column and the gradient. A shallower gradient or a longer column can resolve peaks that a faster method merges. Better resolution can lower a reported purity, because it splits a co-eluting pair the faster method counted as one clean peak.
- The detection wavelength. 214 nm sees the peptide backbone; 280 nm mainly sees aromatic residues. The same sample looks different at each.
- The integration choices. What the analyst includes or excludes, and where they draw the baseline under a tailing peak, moves the percentage.
None of this makes purity meaningless. It makes it method-dependent, which is why a serious certificate names the method, or at least the procedure, so the number can be read in context. A bare percentage with no method behind it is a number you cannot fully interpret, a point we make when we go through what each field on a real certificate proves.
What a clean chromatogram does not prove
A single sharp peak at 99% is good analytical news, and it is also narrow news. It does not confirm the peptide's identity on its own (that needs mass or sequence confirmation), it says nothing about how many milligrams are in the vial, and it does not touch microbial or endotoxin contamination, which HPLC never measures. A purity trace is one instrument's view of one sample. It is necessary, not sufficient.
From the trace back to the synthesis
Read enough chromatograms and a pattern appears: the impurities you see are a fingerprint of how the molecule was built. Deletion and truncation peaks come from imperfect couplings. Epimers come from the chemistry of activating each residue. The longer and more complex the sequence, the more coupling steps, and the more chances for each of these to appear. That is the direct link between the trace and the synthesis route, and it is why the same peptide can be genuinely harder to make cleanly at scale. We follow that thread in our article on how a peptide is actually made, from solid-phase to liquid-phase synthesis.
Products and Categories Referenced
Every batch we sell has a lab report behind the number on the lab reports page, and where a report includes the full trace, it is in the linked document. You can see the purity figures side by side on our purity overview.
GIP/GLP-1/Glucagon agonists and metabolic pathways
First-ever triple-action weight management peptide targeting three receptors at once: GLP-1, GIP, and glucagon. Shown exceptional results in Phase 2 trials - up to 24% weight reduction. The most advanced metabolic peptide available.
3-in-1 skin peptide blend: GHK-Cu 50mg + BPC-157 10mg + TB-500 10mg. Targets collagen synthesis, tissue regeneration, and skin repair for comprehensive dermatological research.
Gastric pentadecapeptide (15 amino acids) known for exceptional tissue repair properties. Promotes wound healing, angiogenesis, and cytoprotection across tendons, muscles, gut, and nerves. Over 30 years of preclinical research.
Full-length 43-amino-acid Thymosin Beta-4, a naturally occurring repair protein, independently confirmed by a third-party CoA from Janoshik. Promotes cell migration and new blood vessel formation for systemic tissue healing. Especially researched for muscle, tendon, and cardiac repair.
Mitochondria-targeted tetrapeptide (Elamipretide) that stabilizes cardiolipin and prevents ROS formation at the source.
Longer, harder-to-synthesize sequences
First-ever triple-action weight management peptide targeting three receptors at once: GLP-1, GIP, and glucagon. Shown exceptional results in Phase 2 trials - up to 24% weight reduction. The most advanced metabolic peptide available.
Modified GHRH analog for lipodystrophy and metabolic liver research
Multi-peptide blends we stock
3-in-1 skin peptide blend: GHK-Cu 50mg + BPC-157 10mg + TB-500 10mg. Targets collagen synthesis, tissue regeneration, and skin repair for comprehensive dermatological research.
4-in-1 anti-aging peptide blend: GHK-Cu 50mg + BPC-157 10mg + TB-500 10mg + KPV 10mg. Targets collagen synthesis, tissue regeneration, skin repair, and anti-inflammatory pathways.
Frequently Asked Questions
FOR RESEARCH USE ONLY. Not for human consumption. Nothing in this article is medical advice or a therapeutic claim. Chromatographic purity describes the composition of a research chemical and is not a safety assessment for any use in humans.
Research context for English-speaking buyers
Most of our English-speaking customers ship to the UK, Ireland, Malta or other English-as-second-language EU territories. The regulatory picture differs per country.
- Relevant authorities
- MHRA (UK, post-Brexit), HPRA (Ireland, EU-aligned), FDA Section 503A bulks list (US, restricted Cat 2 status of several peptides as of 2026)
- Customs and VAT
- EU shipments include 19% VAT; UK shipments after Brexit are now extra-EU and may attract UK VAT plus a handling fee at import
- Typical shipping window
- EU 2-4 working days, UK 4-7 working days, other international 7-14 working days, depending on customs
Research-grade peptides shipped from our EU warehouse are sold for laboratory use only and are not authorised for human or veterinary therapeutic application in any of the destination jurisdictions. US customers should be aware that the FDA Section 503A bulks list classification (and the April 2026 reclassification of twelve compounds) only governs compounding pharmacies, not direct-to-researcher imports for non-clinical work. UK buyers should declare the consignment on import and may be asked for a research justification by HMRC. We provide a CoA per batch identified by colour code rather than serial number; customs sometimes asks for this document when clearing the parcel.